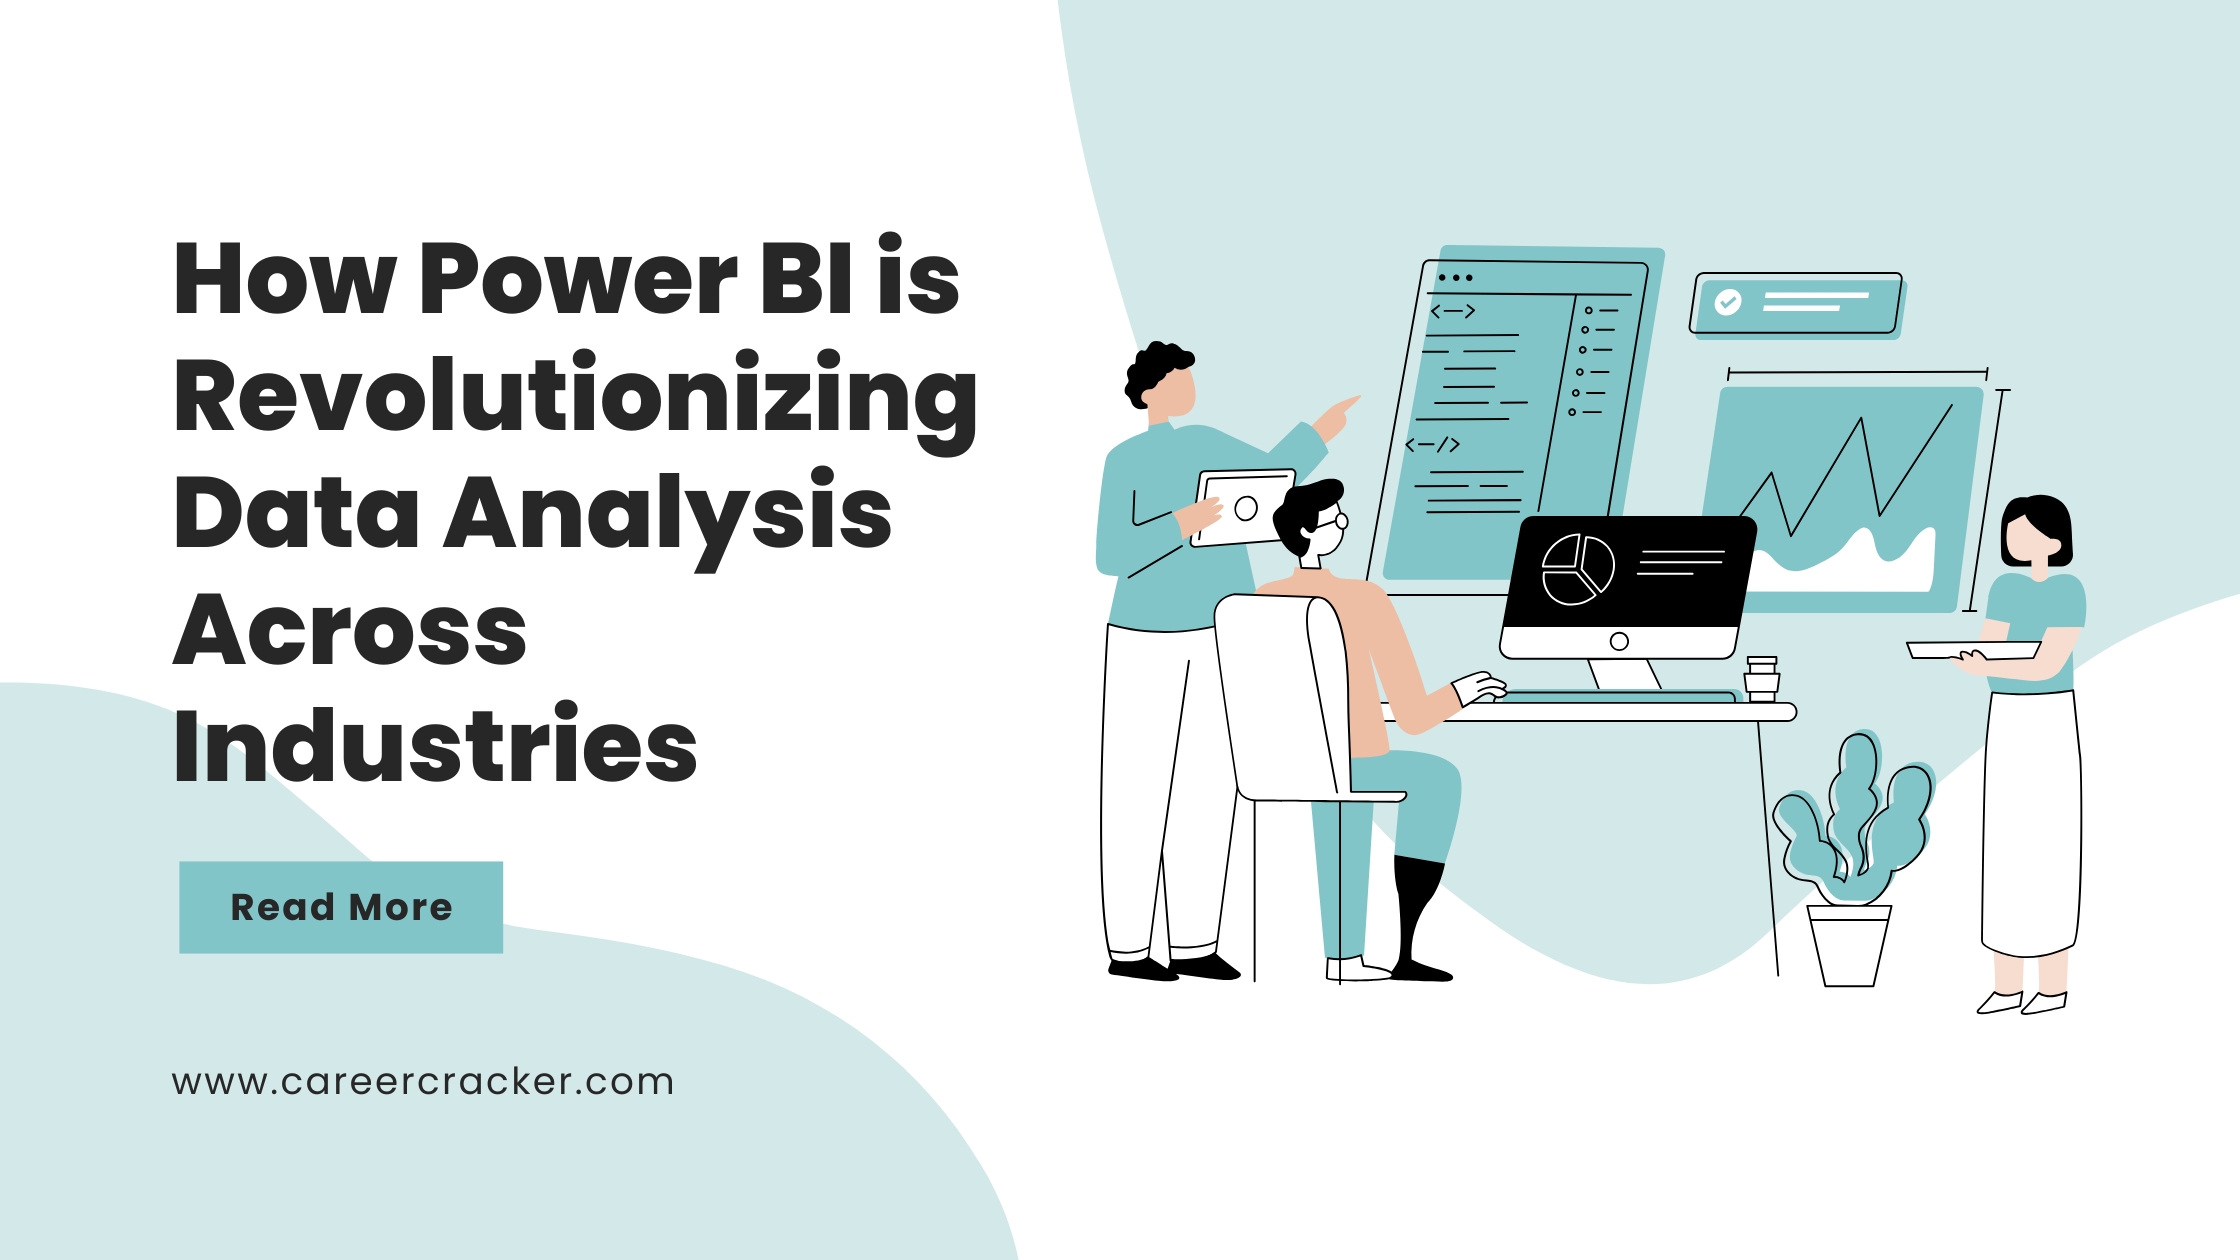
How Power BI is Revolutionizing Data Analysis Across Industries
In today’s data-centric landscape, organizations are inundated with information but often struggle to extract actionable insights. That’s where Power BI, Microsoft’s robust business intelligence platform, is making a significant impact. With its user-friendly interface, seamless data integration, and real-time analytics, Power BI has emerged as the preferred solution for businesses across all industries.
What is Power BI?
Power BI is a comprehensive suite of analytics tools developed by Microsoft. It empowers users to connect to diverse data sources, create rich visualizations, and share insights across the organization. Key features include:
-
Real-time dashboards
-
Interactive reports
-
Custom data connectors
-
AI-driven data modeling
-
Integration with Excel, Azure, SQL, and other Microsoft services
Let’s explore how Power BI is transforming operations across sectors and why it’s becoming a critical asset for organizations.
1. Healthcare: Enhancing Patient Outcomes
In healthcare, fast and accurate data insights can be life-saving. Power BI helps healthcare providers:
-
Track patient admissions, discharges, and readmissions
-
Monitor staff productivity and resource use
-
Evaluate treatment effectiveness
-
Visualize KPIs such as bed occupancy, wait times, and critical cases
Example: A hospital network uses Power BI to monitor ER wait times in real-time across locations, allowing better staff allocation and reduced patient wait times.
2. Finance & Banking: Strengthening Risk and Compliance
Power BI simplifies complex financial data and enables financial institutions to:
-
Visualize up-to-date financial statements
-
Monitor cash flow, revenue, and expenses
-
Detect anomalies to prevent fraud
-
Ensure compliance with regulatory standards
Example: A major bank integrates Power BI with its fraud detection systems to visualize suspicious transaction patterns, reducing fraud identification time by 40%.
3. Retail & E-commerce: Boosting Customer Insights
Retailers depend on data to drive decisions. Power BI supports them in:
-
Analyzing customer buying behaviors
-
Managing inventory and supply chains efficiently
-
Forecasting demand and sales trends
-
Measuring the success of marketing campaigns
Example: An e-commerce leader uses Power BI to study cart abandonment by device type, optimizing the mobile checkout experience based on the insights.
4. Manufacturing: Driving Efficiency and Uptime
Manufacturers rely on operational data from machines and systems. Power BI helps to:
-
Track machine health and predict maintenance
-
Assess production performance and identify delays
-
Analyze logistics and supply chain metrics
-
Compare defect rates across facilities
Example: A manufacturing company integrates IoT data with Power BI to flag abnormal production rates, helping avoid downtime with early alerts.
5. Education: Supporting Data-Driven Learning
Educational institutions use Power BI to:
-
Monitor student performance and engagement levels
-
Track dropout rates and assess interventions
-
Evaluate faculty performance and scheduling efficiency
-
Analyze teaching method effectiveness
Example: A university uses Power BI to evaluate online course success by combining feedback, attendance, and grades across departments.
6. Marketing & Advertising: Optimizing Campaigns
For marketers, Power BI delivers clarity and precision. It enables:
-
Real-time ROI tracking across marketing channels
-
Performance monitoring of live campaigns
-
Large-scale A/B testing analysis
-
Customer journey and conversion tracking
Example: A digital agency creates customized Power BI dashboards for each client, pulling data from platforms like Google Ads, Facebook, and HubSpot.
7. Human Resources: Managing Workforce Smarter
HR departments are embracing Power BI to:
-
Monitor employee engagement and KPIs
-
Analyze hiring funnel efficiency and trends
-
Track diversity, attrition, and training results
-
Build strategic workforce planning dashboards
Example: A multinational organization consolidates recruitment data across regions using Power BI to highlight the most successful hiring strategies.
Why Power BI Leads the BI Market
Here’s what sets Power BI apart:
-
Ease of Use: No coding needed for basic dashboards
-
Scalability: Suitable for startups to enterprises
-
Real-Time Refresh: Instant data updates and alerts
-
AI-Powered: Features like natural language Q&A and predictive models
-
Microsoft Ecosystem: Seamless with Excel, Teams, SharePoint, Azure, and more
The Future of Power BI
As AI, machine learning, and big data evolve, Power BI is becoming a central analytics platform. With advancements like Power BI Copilot and integration into Microsoft Fabric, the tool continues to redefine how decisions are made.
Conclusion
Power BI has moved beyond simple visualization—it’s now a strategic pillar of digital transformation. From healthcare to finance, from education to marketing, Power BI empowers organizations to turn raw data into meaningful, actionable insights.
For anyone aiming to build a future in analytics or upskill a data team, learning Power BI isn’t just a bonus—it’s a necessity.
Hiring Partners


